
Complete workflows
Create and verify a linked budget
Goal: create a working budget and check that changes reach the summary and the chart. Requirements: a blank board or the Budget page from Create a plan from a blank board. Use Data tables, not Plain tables. The amounts are sample values in USD.
| Row | A: Item | B: Quantity | C: Price | D: Formula |
|---|---|---|---|---|
| 2 | Venue | 2 | 250 | =B2*C2 |
| Row | A: Item | B: Quantity | C: Price | D: Formula |
|---|---|---|---|---|
| 3 | Printing | 100 | 1.50 | =B3*C3 |
| 4 | Food | 20 | 18 | =B4*C4 |
| 5 | Equipment | 1 | 140 | =B5*C5 |
| 6 | Total | =SUM(D2:D5) |
- Insert a Data table called
Budget. Use row 1 for the four headers and add the sample rows. - Enter the formulas in D. Apply USD currency to C and D. Check D2=500, D3=150, D4=360, D5=140 and D6=1,150.
- Add a page
Reportand another Data table calledSummary, with the columns Metric and Value.
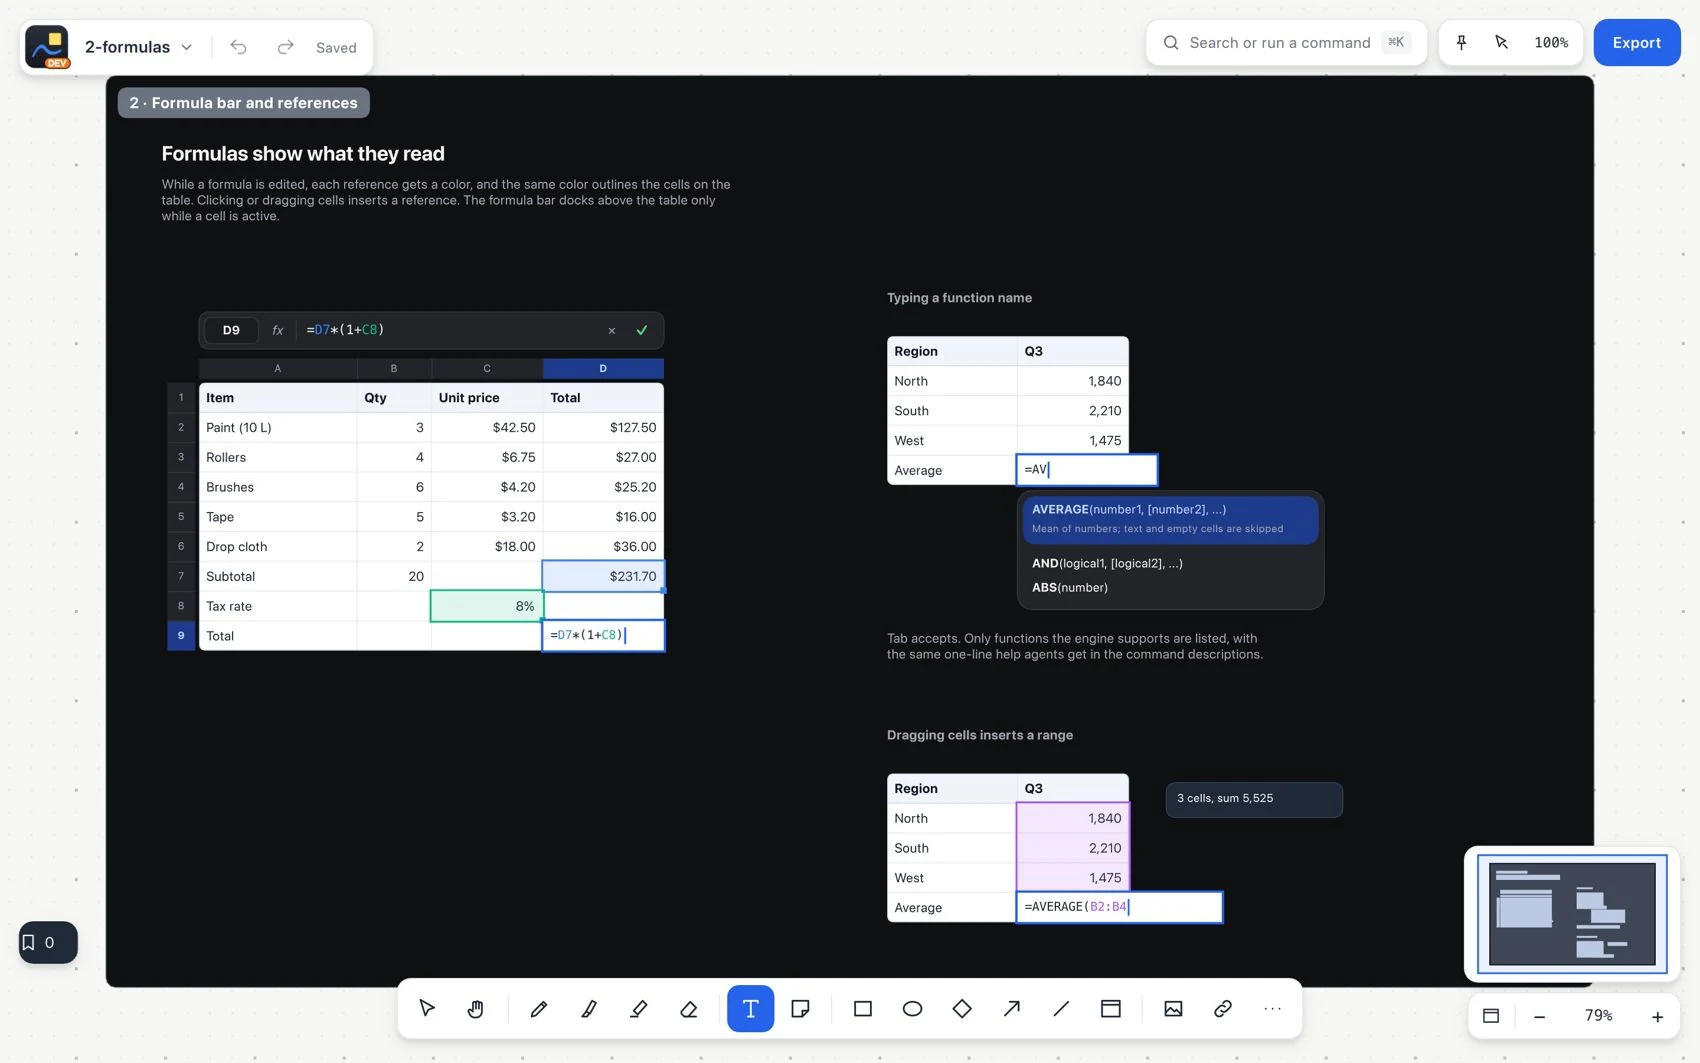
- In Summary, type A2=
Budget totaland B2==Budget!D6; A3=Spending limitand B3=1200; A4=Availableand B4==B3-B2. Available should be 50. - Go back to Budget. Select the labels and totals of rows 2 to 5, choose Create chart and bars. Do not include the grand total as another spending category.
- Save a version
Budget before changing food. Change C4 from 18 to 20.
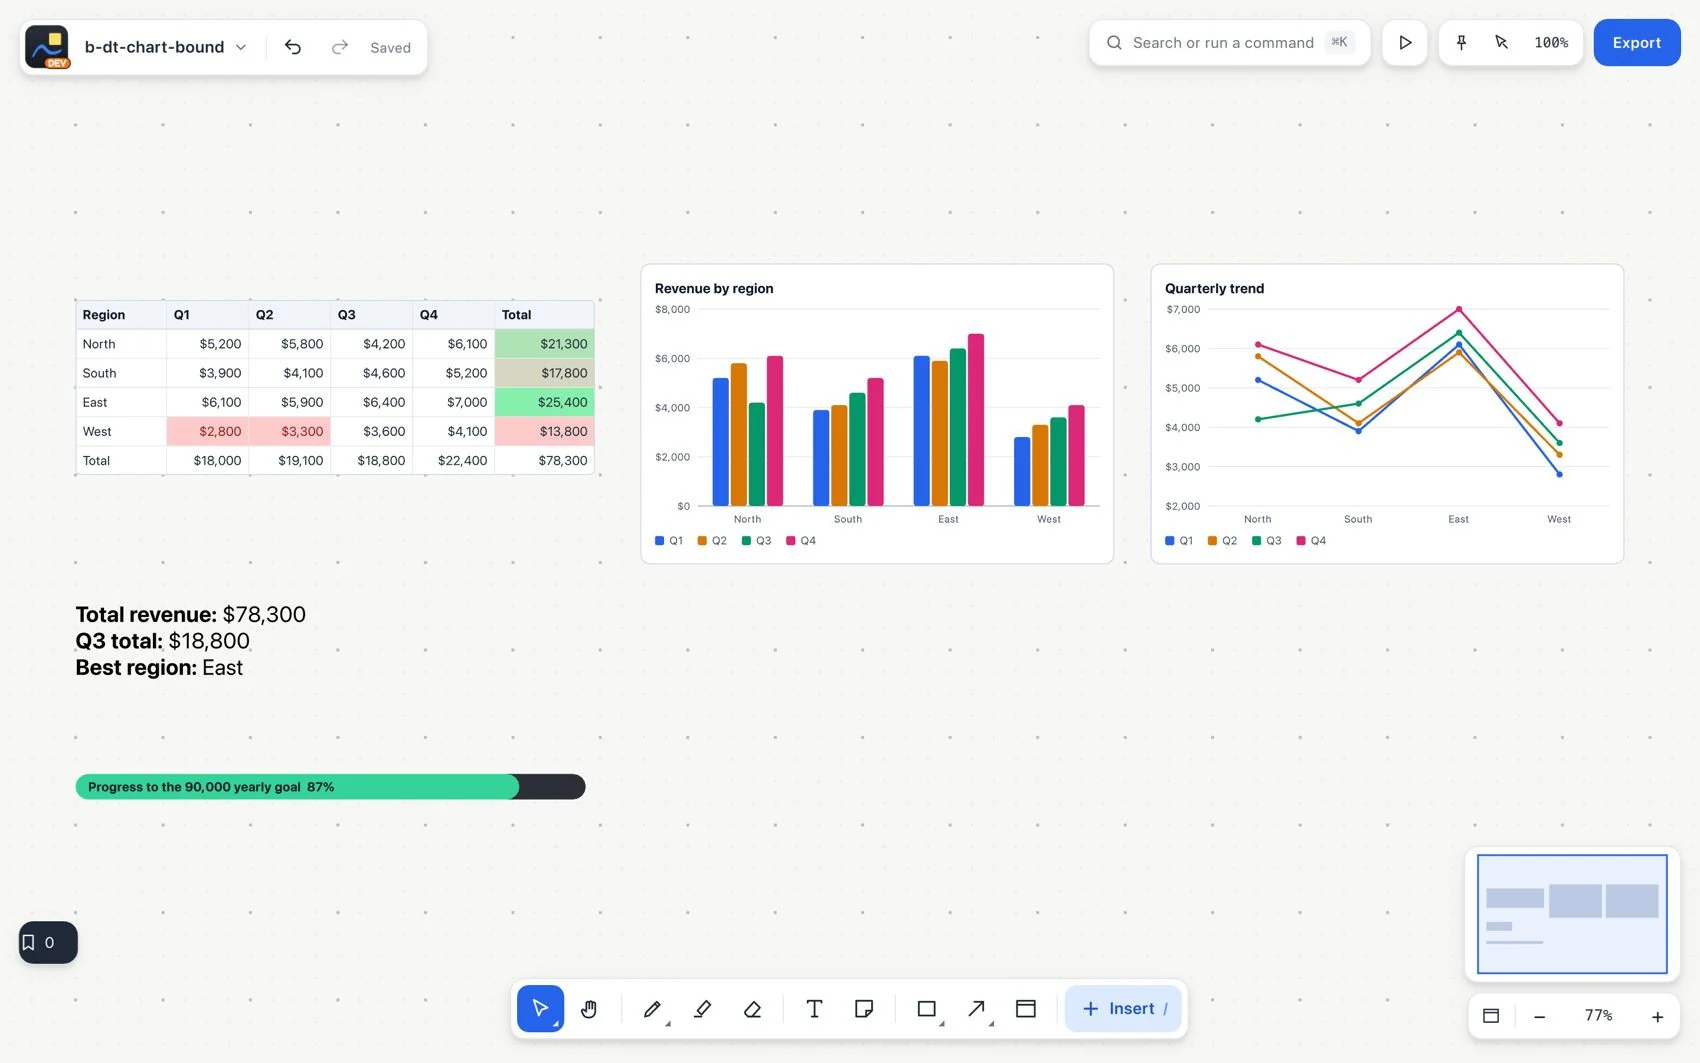
- Check: Food=400, Total=1,190 and Available=10. The Food bar must change too.
- Place the chart and Summary next to an explanation or inside a document. Export and open the report to check the delivered figures.